PHOENIX — The summer of 2020 broke numerous records in Phoenix, including the most 100-degree days, the driest Monsoon season, and the latest 90-degree day in history.
A newly released report shows that the record-breaking summer last year was the result of decades-long trends in increasing temperatures and decreasing rainfall.
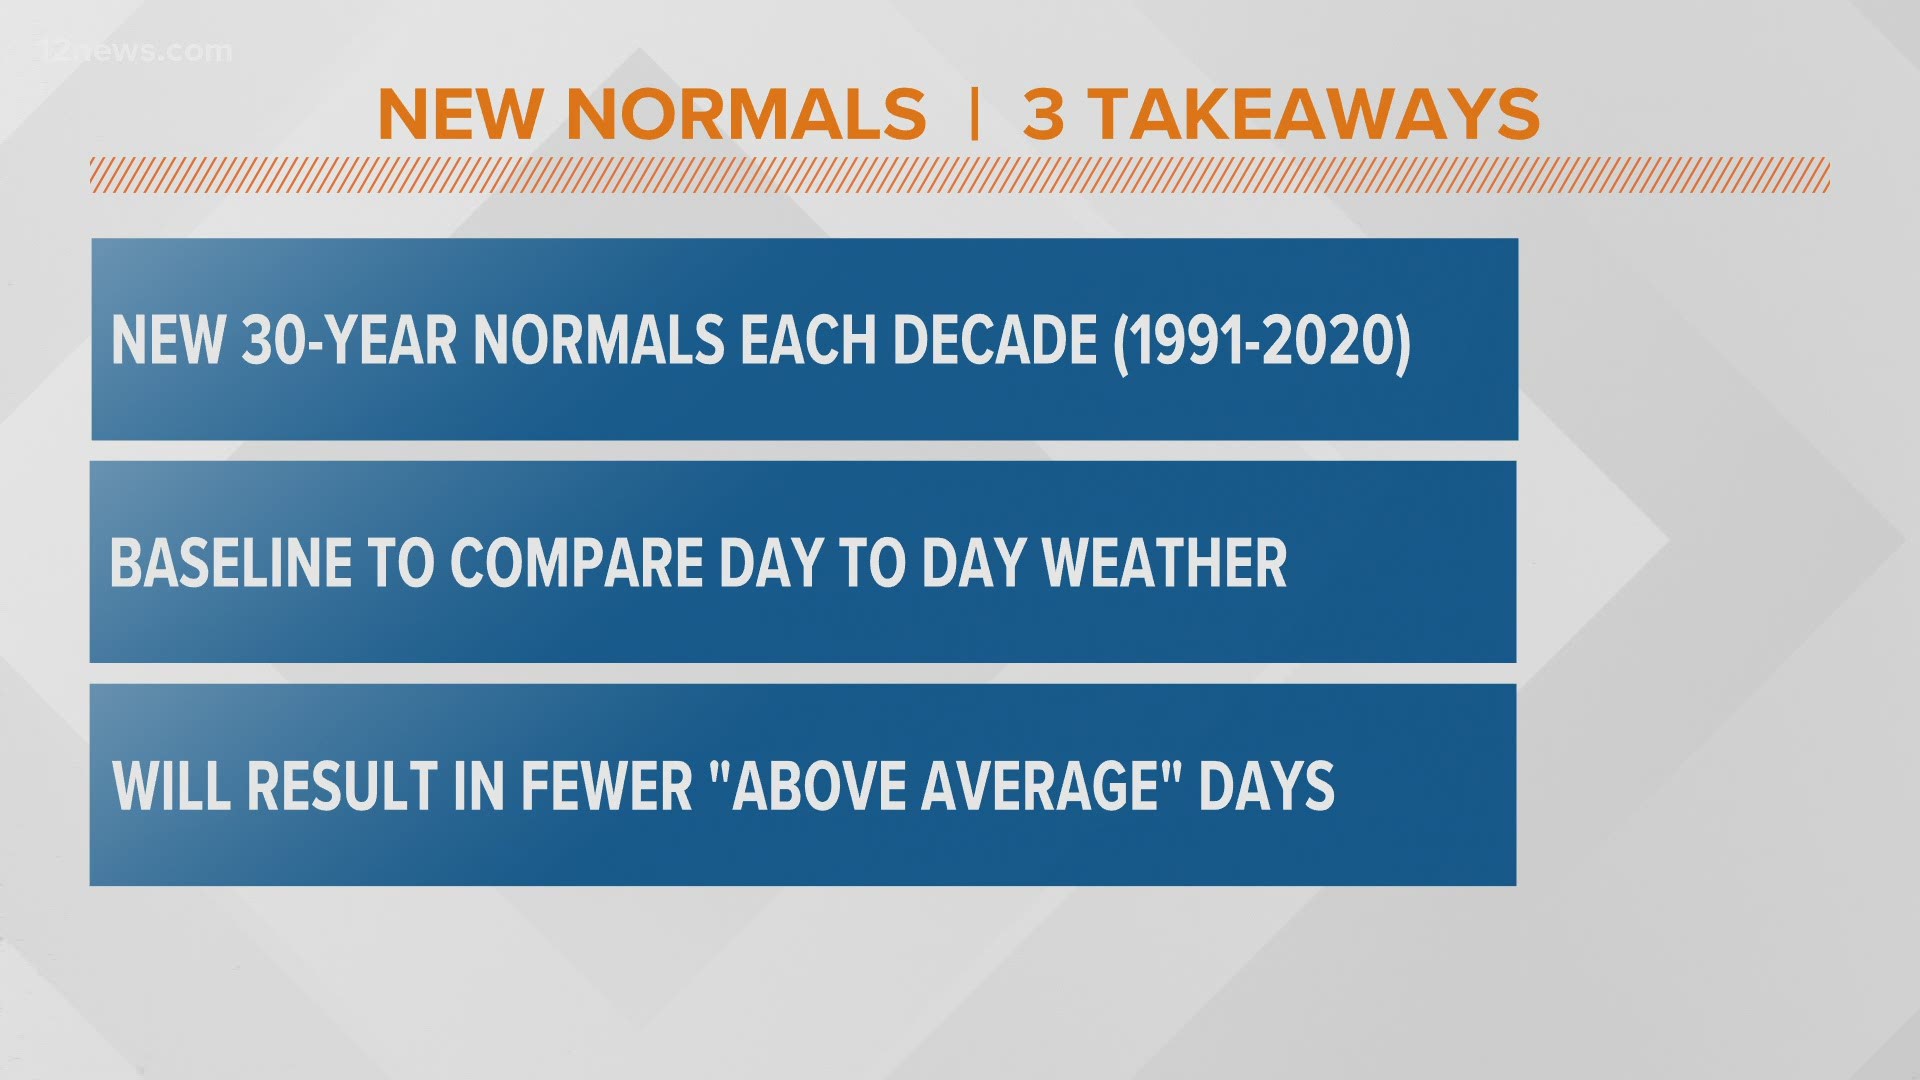
The NOAA National Center for Environmental Information releases updated climate "normals" for temperatures and precipitation once every decade. The latest update released Tuesday includes the past 30 years, from 1991 to 2020.
Some of the most notable changes from the previously established averages include:
- A drop in average rainfall from 8.03 inches to 7.22 inches.
- A drop in average rainfall during the monsoon from 2.71 inches to 2.43 inches.
- An increase in the average number of 100-degree days from 109 days to 111 days each year.
- An increase in the average number of 110-degree days from 18 days to 21 days each year.
"In the strictest sense, a 'normal' of a particular variable (e.g., temperature) is defined as the 30-year average," the NOAA said on it's website.
"For example, the average temperature normal in January for Phoenix would be computed by taking the average of the 30 January values of monthly averaged temperatures from 1991 to 2020."
These averages give forecasters and weather researchers a baseline to compare the Valley's daily weather to.
The normals also help with various other industries across the nation, including agriculture, construction planning, and anticipating a population's energy and water needs.
Read the entire NOAA report on their website here.
Local NWS sites also offer more specific climate data. The Phoenix NWS site can be found here and the Flagstaff NWS site can be found here.
12 News on YouTube
Want to learn more about how Arizona's weather works? Watch our 12 News YouTube Playlist here.

